
Most Canadian entrepreneurs believe competitor analysis requires expensive subscriptions to SEMrush, Ahrefs, or thousand-dollar market research reports. They’re convinced the only path to competitive intelligence involves credit card numbers and complex software dashboards. What if you could access 80% of the intelligence you actually need through free Canadian public databases?
Key Takeaway:
- You can legally and ethically gather a surprising amount of public information about your competitors to gain a strategic advantage. This includes their website content, social media activity, customer reviews, pricing, lead magnets, and marketing strategies — all without hacking or unethical practices. [1]
- Public data sources like their website, Google, social profiles (Instagram, LinkedIn, Facebook), review sites (Trustpilot, Google Reviews), and tools like SimilarWeb or SEMrush can reveal their traffic, keywords, offers, strengths, and weaknesses. [1]
- Use this intelligence to improve your own positioning, create better offers, fix gaps in your marketing, and differentiate yourself. The goal is not to copy them, but to learn what works and serve your audience even better. [2]
- Always stay ethical: never use private data, never impersonate customers, and focus on learning rather than copying. Competitive intelligence done right gives you a massive edge in the coaching and online business space. [2]
Bottom Line: Public information about your competitors is a goldmine for smart coaches. By legally studying what they do well (and where they fall short), you can refine your messaging, improve your offers, and position yourself more effectively — all while staying 100% ethical.
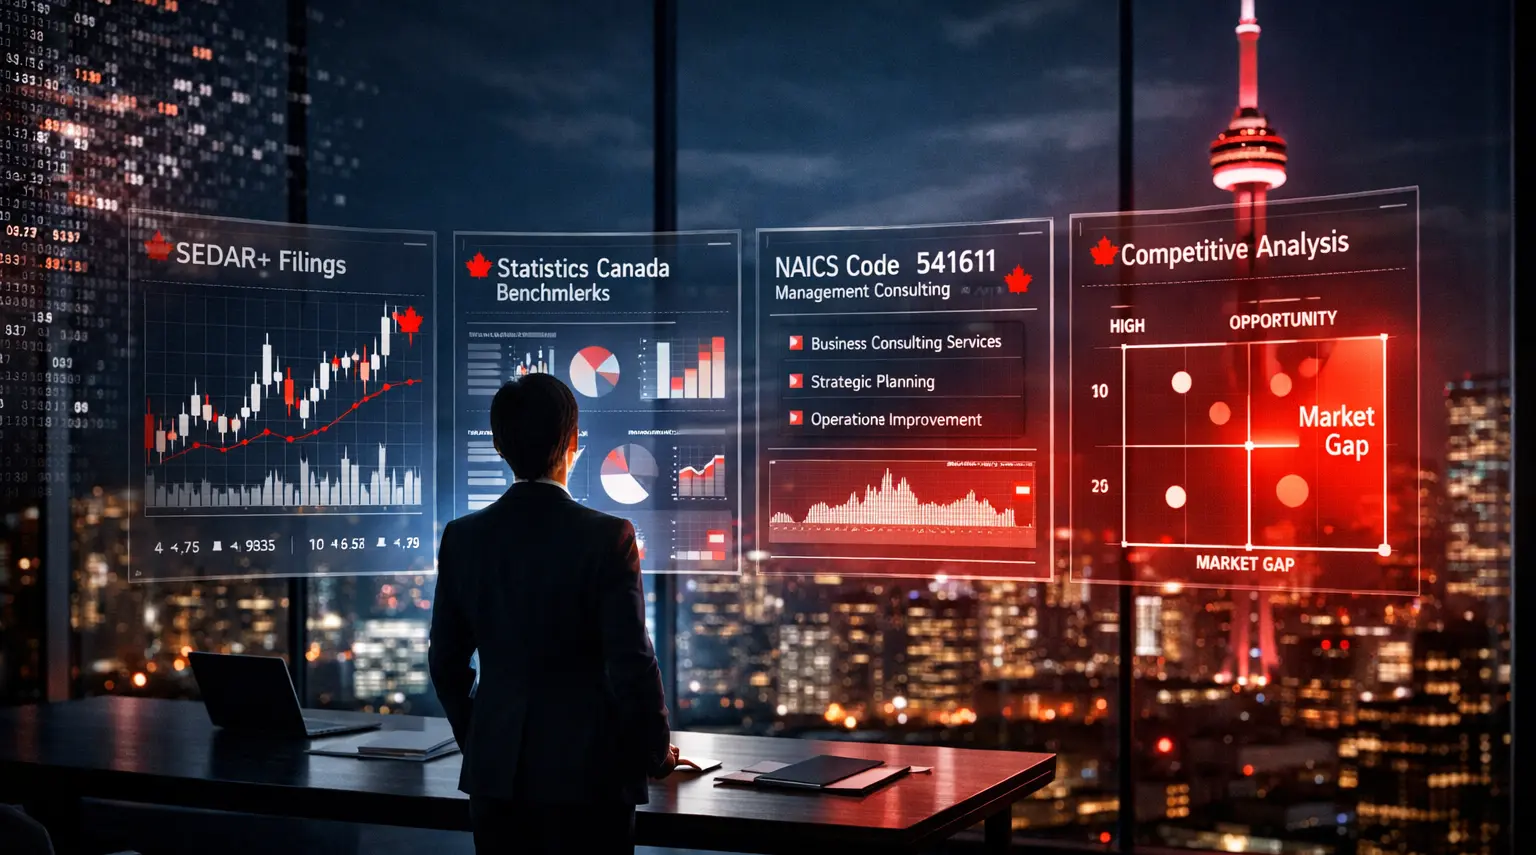
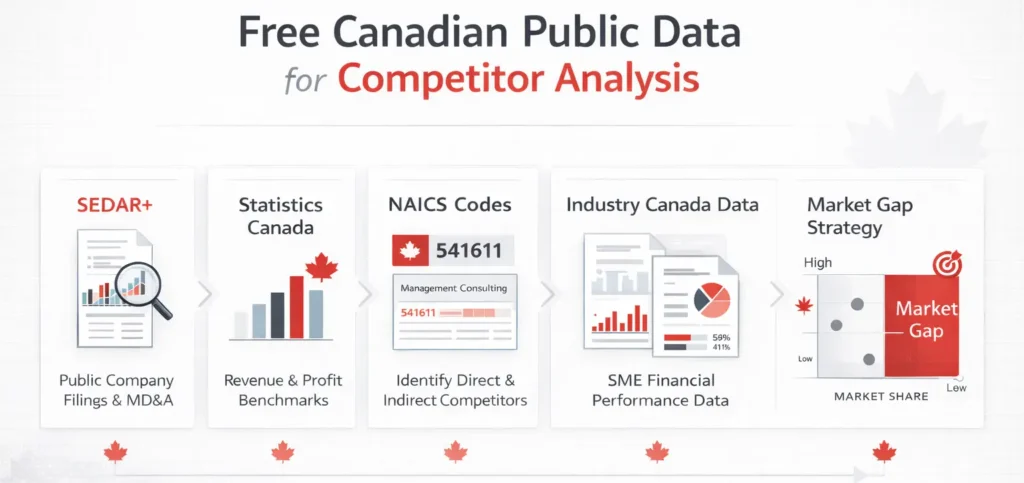
You’re not drowning in too little information. You’re drowning in data but starving for insights. The competitive intelligence you need already exists in publicly accessible Canadian databases like SEDAR+, Statistics Canada benchmarks, and Industry Canada reports. These resources reveal your competitors’ financial health, strategic direction, and market vulnerabilities. Most business owners simply don’t know these gold mines exist or how to extract value from them.
This guide reveals how to leverage Canadian public information sources to understand competitors’ financial performance, market positioning, and strategic blind spots without spending a dime on software. You’ll discover which free databases matter, how to access them, and most importantly, how to turn raw data into decisive business coaching and NLP training advantages. Whether you’re making strategic reinvestment decisions or positioning a new service offering, you’ll know exactly where competitors are strong and where they’re leaving doors wide open.
Why Public Information Beats Paid Tools for Canadian Competitor Analysis
The marketing industry has convinced small business owners that they need enterprise-level software subscriptions to understand their competition. The truth is more nuanced. Expensive tools excel at tracking website traffic, keyword rankings, and social media engagement. But they can’t tell you what public Canadian databases reveal for free: actual financial performance, strategic risks, regulatory compliance issues, and market positioning disclosed under securities law.
Canadian publicly traded companies face mandatory disclosure requirements that would make any paid analytics platform jealous. Through SEDAR+ (the System for Electronic Document Analysis and Retrieval), public companies must file annual reports, quarterly results, management discussions, and material change notifications. These documents reveal revenue trajectories, expense structures, strategic priorities, competitive threats they’re worried about, and risks keeping executives awake at night. You’re reading their internal strategic thinking, not guessing from external signals.
The real advantage Canadian entrepreneurs have lies in bilingual filings and provincial accessibility. Unlike fragmented American databases spread across state and federal systems, Canada’s centralized approach means one SEDAR+ search can surface national competitive intelligence. Statistics Canada provides industry benchmarks broken down by NAICS codes, giving you context that paid tools can’t match: how your competitor’s profit margins compare to industry averages, whether their growth rate is typical or exceptional, and where they’re investing compared to peers.
When should you use paid tools versus public sources? Paid tools shine for digital marketing competitive analysis: tracking backlinks, monitoring social media sentiment, and analyzing website changes. Public databases dominate for strategic and financial intelligence: understanding business models, identifying expansion plans, spotting vulnerabilities in cost structures. Smart entrepreneurs combine both, but they start with free public data to avoid common growth mistakes before investing in premium software.
The limitation of public databases is simple: they only reveal information about companies legally required to disclose it. Privately held competitors remain opaque beyond basic incorporation details and industry aggregates. But even knowing what public competitors are doing, plus how your industry performs on average, puts you miles ahead of businesses operating on assumptions and guesswork.
Understanding NAICS Codes: Your Starting Point for Canadian Competitive Intelligence
Every business operating in Canada gets classified under the North American Industry Classification System. NAICS assigns a six-digit code that categorizes what you actually do, from toy stores (NAICS 451120) to tax preparation services (NAICS 541213). This isn’t bureaucratic paperwork; it’s your key to unlocking systematic competitive intelligence across Canadian databases.
Your NAICS code connects you to three critical intelligence streams. First, it identifies direct competitors through business directories searchable by code. Second, it unlocks Statistics Canada industry data showing average revenues, expenses, employee counts, and productivity metrics for businesses like yours. Third, it reveals indirect competitors and substitutes you might not have considered: businesses solving the same customer problem through different approaches.
Finding your code takes minutes on the Statistics Canada NAICS search tool. Search by keyword describing your primary activity. If you’re a management consultant, NAICS 541611 captures your category. Business coaches often land under 611710 (continuing education services) or 541618 (other management consulting services), depending on how they position their work. The six-digit structure matters: the first two digits represent the sector, and each additional digit narrows the classification. Understanding this hierarchy helps you identify both close competitors (matching all six digits) and adjacent players (matching four or five).
How to Search and Apply NAICS Codes
Start with Statistics Canada’s keyword search. Type what you do in plain language: “life coaching,” “business consulting,” “leadership training.” The system returns relevant codes with descriptions. Read each carefully because subtle differences in wording reflect real market distinctions. Management consulting differs from business consulting in how Statistics Canada categorizes the work, affecting which competitors appear in your searches.
Once you have your code, plug it into Canadian Industry Statistics to see benchmarking data: how many businesses operate in your category nationally and by province, typical establishment sizes, GDP contribution, productivity measures, and international trade patterns if relevant. This baseline shows whether you’re competing in a crowded space or an emerging niche. A code with 50,000 Canadian businesses signals different competitive dynamics than one with 500.
Use competitor NAICS codes to map the landscape systematically. Check business directories filtering by code and location. Search “NAICS 541611 Toronto” to surface management consultancies you’ve never heard of but who compete for the same clients. Cross-reference codes one digit different from yours to identify substitutes: if you’re a life coach (611710), look at vocational rehabilitation services (624310) or career counseling (611710 subsections) to understand who else solves career transition problems.
The practical power comes from combining codes with other databases. When you search SEDAR+ for public companies, knowing their NAICS code tells you which Statistics Canada benchmarks apply to their financials. You can then assess whether their margins, growth rates, and expense ratios outperform, match, or lag industry averages. That context turns raw numbers into strategic intelligence.
Mining SEDAR+ for Strategic Intelligence on Public Competitors
SEDAR+ is Canada’s public company disclosure database, replacing the legacy SEDAR system in 2023. Every publicly traded company and investment fund operating in Canada must file documents here, creating a searchable archive of strategic and financial intelligence that would cost millions if you tried to gather it through other means. You’re accessing the same information institutional investors use to make billion-dollar decisions, except you’re getting it for free.
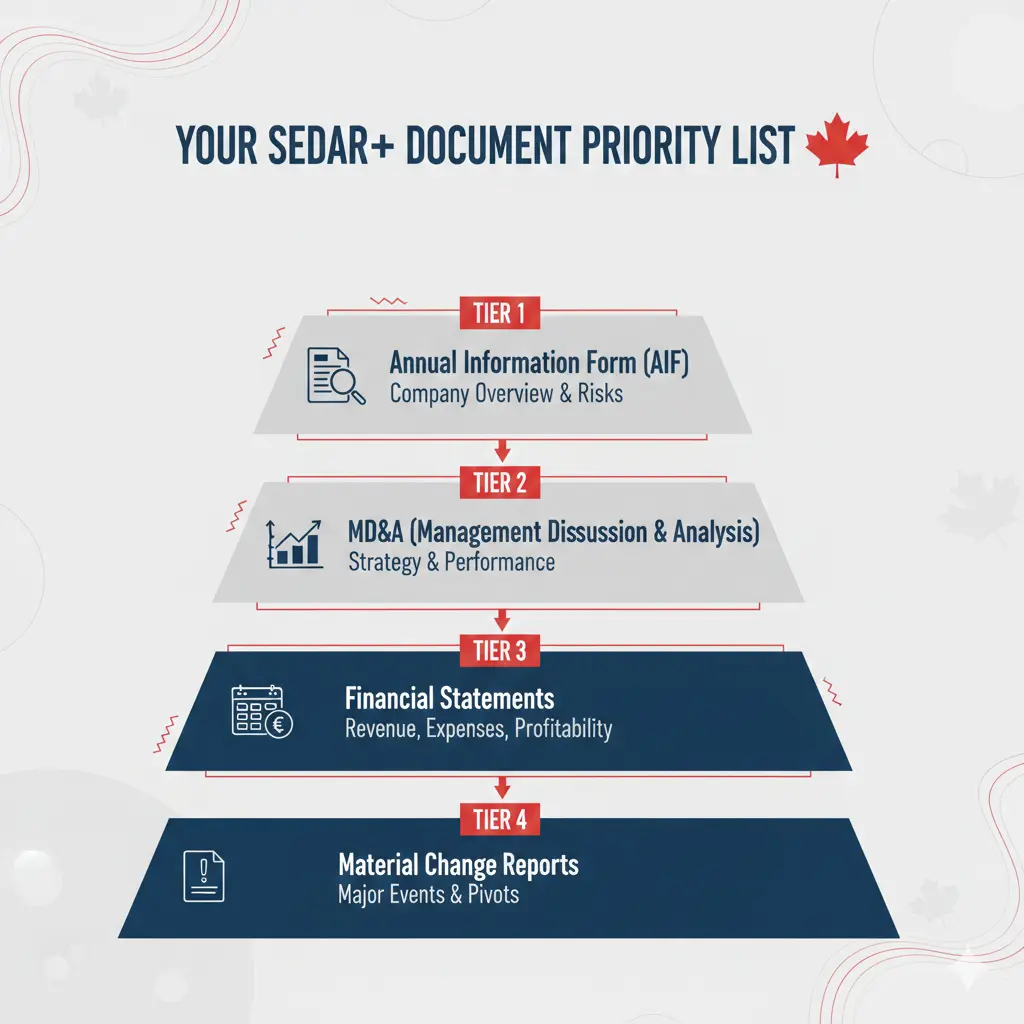
The system holds multiple document types, but three matter most for competitive analysis. Annual Information Forms provide comprehensive company overviews: business descriptions, risk factors, competitive landscape assessments, and regulatory challenges. Management Discussion and Analysis documents reveal how executives interpret their own performance, what they’re prioritizing strategically, and what worries them about the future. Financial statements show the numbers, but MD&As show the thinking behind the numbers.
Material change reports surface when competitors make significant moves: acquisitions, divestitures, new product launches, executive changes, or strategic pivots. These filings arrive in real time, letting you track competitive activity as it happens rather than discovering it months later through news coverage. Set up alerts for specific competitors and you’ll know within days when they file something new.
Accessing SEDAR+ takes seconds. Visit the SEDAR+ platform, click the search function, and enter a company name. The system returns their complete filing history organized by document type and date. No registration required for basic searches. You can filter by filing category to surface just the annual reports or just the MD&As. Documents open as PDFs directly in your browser.
The real value emerges when you read strategically rather than sequentially. Skip to the MD&A section labeled “Outlook” or “Strategy” to understand where competitors are investing next. Jump to risk factor disclosures to see what they identify as competitive threats. Often, they’ll name market shifts or customer behavior changes you should be tracking, too. Compare year-over-year expense categories to spot where they’re cutting costs or ramping up investment, revealing strategic priorities through budget allocation.
Key Documents to Prioritize
Annual Information Forms give you the 30,000-foot view. Read these first to understand a competitor’s complete business model: what they sell, to whom, through what channels, and with what competitive advantages they claim. The risk factors section functions as a competitive SWOT analysis written by their own leadership team. They must disclose threats, so you get an honest assessment of their vulnerabilities.
MD&As provide quarterly and annual strategic commentary. These documents explain performance variances, justify strategic decisions, and project future directions. When a competitor’s MD&A says, “We’re investing heavily in digital transformation to improve customer experience,” you’re learning their priorities for the next 12-24 months. When it says “Margin pressure from increased competition in Region X,” you’re learning where they’re feeling heat.
Material change reports signal inflection points. A competitor filing about a major customer loss, regulatory investigation, or executive departure tells you about instability. One filing about a strategic acquisition or partnership reveals expansion plans before they become public knowledge through press releases. These real-time signals let you respond strategically rather than reactively.
The sophistication comes from reading multiple competitors’ filings comparatively. When three competitors in your space all cite the same risk factor or strategic priority, you’re seeing an industry-wide trend worth understanding. When one competitor mentions a challenge no one else discusses, you’re seeing either their unique vulnerability or their unique awareness of an emerging threat others haven’t recognized yet. That distinction matters when you measure business performance against industry patterns.
Leveraging Statistics Canada and Industry Canada Databases
While SEDAR+ reveals individual company intelligence, Statistics Canada and Industry Canada databases show you the broader competitive landscape. Canadian Industry Statistics analyzes aggregated data across economic indicators: GDP contribution by industry, labor productivity trends, manufacturing output, and international trade patterns. You’re seeing the forest, not just individual trees.
The power lies in benchmarking your performance and your competitors’ performance against industry-wide averages. When you know the typical profit margin for businesses in your NAICS code, you can assess whether a competitor’s disclosed 8% margin represents strength or weakness. When you see that average revenue per employee in your industry is $180,000 and a competitor’s filing shows $240,000, you’ve identified operational efficiency worth understanding.
Canadian Industry Statistics lets you drill down by specific industries using NAICS codes. Search your code to access detailed reports on the number of establishments, size distributions, revenue trends, and geographic concentrations. You’ll learn whether your industry is consolidating or fragmenting, growing or contracting, concentrating in major cities or spreading regionally. These patterns reveal competitive dynamics no single company filing can show you.
The database breaks down industries with granular detail that paid research reports charge thousands to access. You can see not just total industry revenue but how it’s distributed across small, medium, and large players. You can identify whether your sector is dominated by a few major competitors or consists of thousands of small operators. Market structure shapes competitive strategy: competing in a fragmented industry requires different approaches than competing against entrenched leaders.
Financial Performance Data: Your Free Benchmarking Tool
Industry Canada’s Financial Performance Data tool offers something most entrepreneurs don’t even know exists: income statement and balance sheet benchmarks for small and medium enterprises across Canadian industries. You select your NAICS code, and the system generates reports showing median values and quartile distributions for revenue, expenses, profitability, assets, and financial ratios.
This matters tremendously for competitive intelligence. When you see that businesses in your industry typically spend 12% of revenue on marketing and a competitor’s filing shows 20%, you’re learning about their growth strategy. When you see industry standard gross margins at 45% and you’re achieving 55%, you’ve identified a competitive advantage worth protecting and promoting.
The quartile data reveals competitive positioning with precision. If you fall in the fourth quartile for revenue per employee, you’re among the most productive businesses in your space. If you’re in the first quartile for debt-to-equity ratio, you’re either underleveraged and conservative or smart about avoiding financial risk. Context determines interpretation, but the data shows you exactly where you stand relative to peer performance.
Generate custom reports filtering by geography, business size, and time period. Compare your Toronto operation’s performance to provincial or national averages. Track how your metrics evolved over three years relative to industry trends. Identify which expense categories you manage better or worse than typical businesses in your space. This intelligence guides everything from pricing strategy to operational improvement priorities to competitive positioning messages.
The practical application transforms data into decisions. When benchmarking shows your industry’s profitable businesses spend 18% on wages while unprofitable ones spend 32%, you’ve identified a cost management threshold. When it shows top-quartile businesses reinvest 6-8% of revenue in technology and equipment while bottom-quartile businesses reinvest under 2%, you’ve learned what separates industry leaders from laggards. Apply those insights to your own operations and to interpreting what competitors’ public filings reveal about their choices.
What Public Information Is Legally Available About Competitors in Canada?
Canadian securities regulations require publicly traded companies to disclose extensive financial and strategic information through SEDAR+. This includes annual reports showing complete financial statements, quarterly results tracking performance throughout the year, material change reports announcing significant events, and insider trading activity revealing when executives and directors buy or sell company shares. Every prospectus, every proxy circular, every management information circular is publicly accessible within hours of filing.
For private companies, the disclosure requirements shrink dramatically but don’t disappear entirely. You can access incorporation records showing when the business was founded, who the directors are, and what corporate structure they use. Business name registrations reveal trade names and operating locations. Some provinces maintain databases of liens, judgments, and bankruptcies searchable by business name. You won’t see financials, but you’ll confirm basic operational facts and legal standing.
Industry aggregate data from Statistics Canada provides competitive intelligence even when individual companies remain private. You can see average financial performance for all businesses in a NAICS code, broken into size categories and geographic regions. This tells you what typical competitors achieve without requiring any specific company to disclose their individual numbers. When 80% of businesses in your category are private, this aggregated intelligence becomes your primary quantitative benchmark.
The legal boundaries are straightforward. Public filings, public registries, and published statistics are fair game. Information obtained through deception, trespassing, or breaching confidentiality agreements crosses ethical and legal lines. Competitive intelligence focuses on what competitors willingly disclose or what regulators require them to disclose. You’re analyzing publicly available information, not conducting corporate espionage.
Understanding competition law in Canada matters too. The Competition Bureau oversees practices like price fixing, market allocation agreements, and abuse of dominant position. Gathering competitive intelligence is legal. Coordinating with competitors to manipulate markets isn’t. The distinction matters when you’re analyzing competitor pricing or market strategies: you can study what they do, but you can’t collaborate with them to control what customers pay.
Provincial business registries provide additional intelligence layers. Ontario’s business registry shows incorporation details, annual filings, and status for businesses registered in the province. British Columbia’s registry includes similar information. Quebec maintains its own system. Each province structures access slightly differently, but the core information remains consistent: who owns the business, when it was formed, where it’s registered, and whether it’s in good standing.
The sophistication comes from combining multiple public sources into coherent intelligence. Match a company name from a SEDAR+ filing to its NAICS code through business directories. Cross-reference that code with Statistics Canada benchmarks to contextualize their financial performance. Add material change reports to track strategic moves over time. Layer in business registry information to understand ownership structures and subsidiary relationships. Each source individually provides partial insight; combined, they reveal comprehensive competitive positioning.
How Can I Find Competitors I Don’t Already Know About?
Your known competitors represent the obvious ones: businesses you encounter directly, companies customers mention, and organizations appearing in the same search results. The unknown competitors matter just as much as businesses serving your customers through different channels, emerging players not yet on your radar, and indirect competitors solving the same problems with alternative approaches.
NAICS codes give you systematic discovery capability. Search Statistics Canada’s business databases, filtering by your six-digit code and geographic area. You’ll surface companies you’ve never heard of operating in your exact category. Broaden the search to five-digit or four-digit NAICS matches to identify adjacent competitors: businesses similar enough to compete for budget but different enough that you wouldn’t find them through direct market observation.
Google searches structured around industry terminology reveal local players. Search “[your service] + [city]” with variations like “Toronto business coach,” “Vancouver leadership training,” “Montreal NLP practitioner.” Review the first five pages of results, not just the top three listings. Many effective competitors rank well enough to capture customers but not prominently enough to appear in positions one through three. They’re succeeding under your radar.
LinkedIn’s company search function filtered by industry codes surfaces B2B competitors particularly well. Search for companies in your industry, filtered by location and size. Review their “People Also Viewed” sections to discover related businesses. Check who appears in your network connections’ current employers. B2B competitors often share professional networks before they share customer bases, making LinkedIn discovery effective for service businesses.
Trade associations publish member directories that function as competitor databases. If you operate in professional services, coaching, consulting, or specialized B2B markets, relevant associations maintain searchable directories of member firms. Some charge for directory access, others provide it free to drive member visibility. Even non-members can usually access basic directory searches to identify who’s active in the space.
Trade show exhibitor lists reveal who invests in industry visibility. Search for shows relevant to your market and download or review their exhibitor directories. Companies spending money to exhibit are actively competing for market share and awareness. They’ve self-identified as serious players worth tracking. Follow the same shows year over year to spot new entrants and exits.
Google Maps reveals local competitors with physical presence in ways business databases miss. Search your service category on Maps in different neighborhoods and cities. Review the listings, read customer reviews to understand positioning, and note how they describe their offerings. Local search behavior differs from organic search, surfacing different competitors who optimize for proximity-based customer acquisition.
The discovery process isn’t one-time research. Make it a quarterly habit: NAICS search for new registrations, Google Maps check for new locations, LinkedIn sweep for emerging players, trade association directory review for recent members. Competitive landscapes shift continuously. New businesses launch, existing ones pivot into your space, and indirect competitors add services that make them direct threats. Systematic discovery quarterly keeps you informed, not surprised.
Turning Data Into Strategic Decisions: The NLP Approach to Competitive Positioning
You can drown in competitive data and still make terrible decisions. I’ve watched smart entrepreneurs collect spreadsheets full of competitor intelligence, then freeze when it’s time to act on what they’ve learned. The problem isn’t a lack of information. The problem is how your brain processes competitive comparison.
Most business owners encounter competitors and immediately trigger scarcity thinking. If competitor X is strong in area Y, that area must be unavailable to you. If they’re growing faster, you must be losing. If they have bigger teams, better websites, or more impressive client lists, you’ve already lost before you start. This mindset turns competitive intelligence into competitive paralysis.
Here’s what successful entrepreneurs understand: competitors validate your market, they don’t threaten your space. When you discover strong competitors, you’ve confirmed demand exists. When you identify their strengths, you’ve located areas where customers already know they want solutions. When you spot their weaknesses, you’ve found the gaps where you can position differently and win.
The NLP approach to competitive positioning focuses on differentiation, not imitation. You’re looking for white space, not trying to do what they do slightly better. When you analyze a competitor’s positioning, you’re asking: what are they not serving? What customer segment finds their solution almost right but not quite? Where do their strengths create corresponding weaknesses?
One of my clients struggled with this exact pattern. Despite running a profitable consulting business, he couldn’t break through to the next level. Every time he researched competitors, he’d find someone doing something he wasn’t, and he’d immediately feel behind. The breakthrough came when we identified his “competitor comparison blocks”, limiting beliefs that kept him focused on what others were doing instead of his own strategic advantages.
We shifted the question from “How do I catch up to competitors?” to “What can I offer that competitors structurally cannot?” His competitors competed on scale and systems. He competed on personalized attention and transformation depth. Their strength in scalability created a weakness in customization. His smaller size, previously viewed as a disadvantage, became his competitive advantage for clients who wanted deep, individualized work rather than productized programs.
This mindset shift from scarcity to abundance in competitive analysis unlocks strategic clarity. You stop trying to be all things to all people. You start asking which customers are best served by your unique combination of strengths, experience, and positioning. You let competitors have the customers they’re built to serve. You focus on the customers you’re built to serve better than anyone else.
The NLP techniques for business growth that work best here involve reframing how you process competitive intelligence. Instead of “They’re better at X,” ask “What does their focus on X prevent them from doing?” Instead of “They have more resources,” ask “What constraints do those resources create?” Instead of “They’re growing faster,” ask “What quality or depth am I maintaining that they’re sacrificing for speed?”
Leadership training programs reinforce this approach by building confidence in your unique value rather than anxiety about competitive comparison. Leaders who understand their positioning make decisive strategic choices. They don’t waffle between copying competitors and ignoring market realities. They synthesize competitive intelligence into differentiation strategies that create sustainable advantages.
The practical application looks like this: you gather competitor data systematically. You analyze it objectively. Then you filter it through strategic questions focused on differentiation. Where do competitors cluster? That’s where you might avoid, unless you have overwhelming advantages. Where are competitors absent or weak? That’s where opportunity likely exists. What do all competitors assume customers want? That assumption might be wrong, creating space for a different approach.
This transforms competitor analysis from a depressing exercise in comparison to an empowering search for strategic opportunity. The data remains the same. Your interpretation changes everything. You move from “I can’t compete with them” to “I don’t need to compete with them, I can serve different customers or serve the same customers differently.”
How Often Should I Update My Competitor Analysis?
Competitive landscapes shift continuously, but analyzing them daily creates paralysis, not insight. You need rhythm, not obsession. Conduct comprehensive competitor analysis annually, examining SEDAR+ filings, Statistics Canada benchmarks, market positioning changes, and strategic shifts across all major competitors. This becomes your baseline understanding of the competitive environment.
Quarterly pulse checks keep that baseline current without consuming excessive time. Dedicate two hours every quarter to reviewing new SEDAR+ filings from public competitors, checking Statistics Canada for updated industry data, and sweeping for new market entrants through NAICS searches and business directories. Track major changes: new locations, executive turnover, product launches, pricing shifts. Update your competitive matrix with new information but resist the urge to overhaul your strategy quarterly unless you spot genuine inflection points.
Real-time monitoring through alerts provides ongoing awareness without ongoing effort. Set up Google Alerts for competitor company names, key executives, and industry terms. Configure SEDAR+ notifications for specific public competitors you track closely. When material changes occur, you’ll know within days. Most alerts will be minor news mentions, routine filings. The signal emerges when you spot patterns or outliers worth investigating deeper.
Emergency competitive analysis happens when market conditions demand it. A major competitor gets acquired, conduct an immediate analysis of the acquiring company’s strategy and what it means for market dynamics. A well-funded new entrant launches in your space, analyze their positioning, pricing, and go-to-market approach quickly to assess the threat level. A competitor’s public filing reveals financial distress. Evaluate whether their weakness creates an opportunity for you to capture displaced customers or acquire assets.
The discipline comes from separating monitoring from analysis. Monitoring happens continuously through automated alerts and quarterly check-ins. Analysis happens on a schedule: annual deep dives, quarterly updates, plus event-driven sessions when justified. Monitoring without analysis creates information overload. Analysis without monitoring creates blind spots. Balanced rhythm creates competitive awareness without competitive obsession.
Most entrepreneurs err in one direction or the other. Some ignore competitors entirely, assuming their unique offering insulates them from competitive pressure. They get surprised when market dynamics shift or new entrants appear. Others check competitor websites daily, track every social media post, and obsess over every minor move. They lose focus on building their own business while watching everyone else’s.
The productive middle ground acknowledges that competitors matter while recognizing you can’t control what they do. You can only control your strategic response. Annual analysis establishes the baseline. Quarterly updates maintain currency. Real-time alerts catch major shifts. Everything else is noise you can safely ignore while you focus on serving customers and building your business.
Schedule the work literally. First Monday of January: annual competitive analysis day. First Monday of April, July, and October: quarterly update sessions. Set recurring calendar blocks. Assign responsibility if you have team members. Track what you learn in a consistent format so year-over-year comparisons become easy. Make it routine rather than reactive, disciplined rather than desperate.
Free and Low-Cost Tools to Complement Public Data
Public Canadian databases provide strategic and financial intelligence, but they don’t cover everything competitive analysis demands. Combining free government data with free or low-cost tools creates comprehensive competitive awareness across multiple dimensions.
Google Alerts monitors competitor mentions across web content, news sites, blogs, and forums. Set alerts for competitor company names, key executives, and distinctive product names. You’ll receive email notifications when new content appears, mentioning your search terms. Most results will be routine, but you’ll catch product launches, media coverage, customer complaints, and industry commentary as they happen.
SimilarWeb’s free tier estimates website traffic, referral sources, and audience demographics for competitor sites. Enter a competitor’s domain and you’ll see monthly visit estimates, top traffic sources, audience geography, and similar sites. The free version limits detail and historical data, but it’s enough to understand which competitors generate significant online traffic and where that traffic originates.
LinkedIn reveals competitor hiring patterns, organizational structure changes, and employee movement. Follow competitor company pages to see when they post job openings, hiring signals growth, and specific roles reveal strategic priorities. Track employees in your network who work for competitors; when they change roles or companies, you learn about organizational stability and talent retention. LinkedIn’s free version provides enough visibility for basic competitive intelligence.
Social Searcher provides free social media monitoring across Twitter, Facebook, Instagram, and other platforms. Search competitor names, hashtags, or keywords to see recent social mentions. The free tier allows 100 searches daily and saves two searches with email alerts. You’ll track competitor social engagement, customer sentiment, and campaign activity without paying for enterprise social listening tools.
Browse AI monitors website changes automatically, alerting you when competitors update pricing pages, product offerings, or other key content. You set up monitors for specific URLs or site sections, and the tool checks for changes on a schedule you define. The free tier includes limited monitors and checks, sufficient for tracking a handful of critical competitor pages.
Google Trends shows search interest over time for competitor brands, products, or industry terms. Compare multiple search terms to see relative popularity. Filter by geography to understand regional interest patterns. Identify when search interest spikes or declines for competitor names, revealing the impact of their marketing campaigns or news coverage.
The power multiplies when you combine these tools strategically with public databases. Use SEDAR+ and Statistics Canada for financial and strategic intelligence. Layer LinkedIn monitoring to understand their talent acquisition and organizational changes. Add website traffic analysis to assess their digital presence. Monitor social media for customer sentiment and campaign messaging. Set alerts to catch news and announcements immediately.
Each tool individually provides a partial perspective. Combined, they create multidimensional competitive awareness: financial health from public filings, strategic direction from government databases, digital presence from traffic analysis, organizational changes from LinkedIn, customer perception from social listening, and real-time developments from alerts.
The discipline involves resisting tool proliferation. More tools create more noise unless you have clear purposes for each. Select tools that answer specific questions you need answered repeatedly. If you’re not in a digital marketing arms race with competitors, website traffic data might not matter. If you compete primarily on relationships and referrals, social media monitoring might be a low priority. Match tools to your competitive dynamics, not to what’s available for free.
Budget considerations matter. Free tiers exist to convert you to paid subscriptions eventually. Evaluate whether the free version provides sufficient intelligence or whether limitations force upgrade decisions. Sometimes paying $20-50 monthly for a tool that saves hours of manual research makes economic sense. Other times, the free version provides 90% of the value and paid features add marginal benefit.
The complete intelligence toolkit combines Canadian public databases (free, comprehensive, official), monitoring tools (mostly free, automated, real-time), and occasional paid tools that solve specific high-value problems. Build your stack gradually, adding tools as competitive questions emerge that existing sources can’t answer. Review quarterly whether you’re using what you’ve set up. Eliminate tools that generate alerts you ignore or data you don’t use.
FAQs
1. What are NAICS codes and how do they help with competitor analysis in Canada?
NAICS (North American Industry Classification System) codes are six-digit classifications that categorize Canadian businesses by their primary activities, such as 541611 for management consulting or 611710 for educational support services. They unlock free public databases like Statistics Canada and Canadian Industry Statistics, allowing you to benchmark average revenues, expenses, productivity, and market size for your industry. By searching your NAICS code and filtering by location, you can systematically identify direct and adjacent competitors, reveal industry trends, and spot strategic gaps all without expensive paid tools.
2. How can I use SEDAR+ for free competitor analysis on Canadian public companies?
SEDAR+ is Canada’s free, centralized database for public company disclosures, offering instant access to annual reports, MD&As, material change reports, and more. No registration is needed for basic searches. Enter a competitor’s name to review key sections like “Risk Factors” and “Outlook” to uncover their strategic priorities, vulnerabilities, expense structures, and future plans. When combined with their NAICS code and Statistics Canada benchmarks, SEDAR+ delivers deeper financial and strategic intelligence than most paid platforms, legally revealing what public competitors are worried about and where they’re leaving market opportunities open.
3. What free Canadian databases provide financial benchmarks for competitor analysis?
Statistics Canada’s Canadian Industry Statistics and Industry Canada’s Financial Performance Data tool deliver free, NAICS-based benchmarks including median revenues, profit margins, expense ratios, and quartile distributions for small and medium enterprises. Simply input your industry code to generate reports that show how typical businesses perform nationally, provincially, or by size, perfect for contextualizing a competitor’s disclosed financials. This official data helps you quickly determine whether a rival’s margins or growth rates are industry-leading, average, or lagging, turning public filings into clear strategic insights without spending on research reports.
4. How do I discover unknown competitors using public information in Canada?
Start with Statistics Canada’s NAICS search tool to find your six-digit code, then filter business directories and Canadian Industry Statistics by code and location to surface companies you’ve never encountered. Supplement with targeted Google searches (“[service] + [city]”), Google Maps for local listings, LinkedIn industry filters, trade association directories, and provincial business registries to uncover indirect and emerging players. Make this a quarterly routine, so you continuously map the full competitive landscape, spot substitutes, and identify market gaps using only free public sources.
5. How often should I conduct competitor analysis using Canadian public sources?
Perform a comprehensive annual deep dive into SEDAR+ filings, Statistics Canada benchmarks, NAICS data, and competitor positioning to establish your baseline understanding of the market. Follow with quick quarterly pulse checks (2–3 hours) to review new filings, updated industry stats, and emerging entrants, while setting free real-time alerts on SEDAR+ and Google for major changes. This disciplined rhythm keeps you informed without obsession, allowing you to spot inflection points and adjust strategy effectively using Canada’s powerful free public resources.
Conclusion
Competitive intelligence isn’t about fear or copying. It’s about clarity and positioning. Canadian entrepreneurs have access to world-class public information infrastructure that reveals exactly what competitors are doing, how they’re performing, and where they’re vulnerable. SEDAR+ filings, Statistics Canada benchmarks, NAICS databases, and Industry Canada reports provide intelligence previously available only to large enterprises with research budgets.
But data without strategic interpretation creates paralysis, not advantage. The businesses that win aren’t the ones with the most competitor information. They’re the ones who transform insights into decisive action. They identify gaps competitors leave open. They position where they’re uniquely strong rather than where competitors are generically successful. They use intelligence to inform strategy, not to copy what everyone else is doing.
Start simply. Choose one major competitor. Find their NAICS code. Pull their SEDAR+ filings if they’re public. Compare their performance to Statistics Canada industry averages. Identify one strategic insight from that analysis. Ask yourself: what does this reveal about market opportunity? What does their positioning leave unclaimed? Where can I differentiate rather than compete directly?
Build from there. Add quarterly monitoring. Set up automated alerts. Expand your analysis to include three competitors, then five. But never let competitor analysis replace customer focus or strategic clarity. The goal isn’t to know everything about everyone competing in your space. The goal is to understand your market well enough to position your unique value where it matters most.
Your transformation starts with one decision: will you operate on assumptions about competitors, or will you leverage the free intelligence Canadian databases provide? Most entrepreneurs choose ignorance by default, not because information is unavailable but because they don’t know it exists or how to use it. You now know both.
Ready to transform competitive intelligence into strategic advantage? Explore how NLP training for business and leadership coaching can help you break through competitive analysis paralysis and build an unshakeable market position. Because the ultimate competitive advantage isn’t knowing what others do, it’s knowing who you are and standing there with confidence.