

You’re sitting across from your CFO with a $150,000 leadership training proposal. You’ve done your homework. You know your managers need development. You’ve seen the engagement scores, the turnover data, the succession planning gaps. The ROI of Leadership Training obvious to you.
Key Takeaway:
- Leadership training delivers one of the highest returns on investment of any business expense. Well-designed programs can generate between $4 and $7 for every $1 invested through increased productivity, better employee retention, stronger team performance, and higher revenue. [1]
- The real ROI comes from measurable improvements: enhanced decision-making, stronger communication, higher employee engagement, reduced turnover, and the ability to develop future leaders internally rather than hiring externally. [1]
- To maximize ROI, choose training that is practical, ongoing, and tailored to your company’s specific challenges rather than generic one-off workshops. The best programs combine leadership skills development with real-world application and accountability. [2]
- Investing in leadership training is not just about improving individual leaders — it transforms company culture, boosts innovation, and creates a competitive advantage that compounds over time. [2]
Bottom Line: Leadership training is one of the smartest investments a company can make. When done right, it delivers exceptional ROI by improving performance, retaining talent, developing future leaders, and driving sustainable business growth.
Bottom Line: Leadership training is one of the highest-ROI investments a company can make—when done right (targeted, measurable, sustained), it transforms culture, performance, and bottom-line results far beyond the initial cost.
Then your CFO asks: “Why not just hire better managers?”
And there it is. The question that kills brilliant training proposals before they even get started. Because here’s the uncomfortable truth: 75% of organizations rate their leadership development programs as “not very effective.” Only 18% say their leaders are “very effective” at achieving business goals. CFOs see these statistics too. They’ve approved training budgets before that delivered completion certificates instead of business results.
But here’s what separates the proposals that get approved from the ones that die in budget reviews: The ability to speak CFO language. Not engagement. Not development. Not potential. Return on investment. Cost savings. Productivity gains. Profitability impact. Measurable business outcomes tied directly to the bottom line.
The organizations that get this right, the 25% whose leadership training programs actually deliver, see an average of $7 back for every dollar invested. Some see returns ranging from $3 to $11 depending on program quality and measurement rigor. First-time manager training specifically delivers 29% ROI in just three months and 415% annual returns. These aren’t feel-good metrics. They’re CFO-approved business outcomes.
I’ve sat in hundreds of budget meetings where brilliant training proposals died because they couldn’t translate “better leaders” into “lower costs and higher productivity.” I’ve also watched proposals get enthusiastic approval because they demonstrated exactly how leadership development would protect existing budgets from turnover bleeding and improve operational efficiency, the CFO’s top priority.
This isn’t about convincing your CFO that leadership matters. It’s about building a bulletproof business case using their formula, their metrics, and their decision framework. Let me show you exactly how to do it.
Why CFOs Skeptically View Leadership Training (And Why They’re Not Wrong)
Let’s start with empathy for your CFO’s position. They’re not being difficult when they question your training proposal. They’re doing their job.
The CFO’s 2025-2026 Reality: Cost Control is King
Your CFO’s world revolves around operational efficiency. 2024 CFO priorities surveys consistently rank “increasing operational efficiencies and productivity” as the number one enterprise-wide priority. Approximately 64% of CFOs increased their budgets in 2024, but they did so strategically—every dollar needs to demonstrate clear return.
Here’s the tension: While 68% of CFOs cite talent and leadership development as a priority, it consistently ranks lower than data analytics, cost optimization, and financial planning. Why? Because talent development often lives in the “important but hard to measure” category, while cost control delivers immediate, visible impact.
The broader context makes this worse. Corporate training spending actually fell from $101.8 billion in 2023 to $98 billion in 2024—a 3.7% drop—even as strategic external content and service spending grew 23%. Translation: CFOs are cutting general training budgets while becoming more selective about where they do invest. The bar for justification has risen significantly.
Your CFO’s mandate is crystal clear: Prove every dollar delivers measurable business outcomes. Not completion rates. Not satisfaction scores. Business outcomes that show up in retention data, productivity metrics, and profitability reports.
The Legitimate Reasons for CFO Hesitation
Your CFO’s skepticism isn’t unfounded. Comprehensive 2024-2025 research reveals some sobering realities about leadership development:
75% of organizations rate their leadership programs as “not very effective”
Only 18% say their leaders are “very effective” at achieving business goals
Almost 60% of first-time managers receive zero training when they transition into leadership roles
Despite billions in investment, many programs deliver certificates instead of capability
So when you ask for $150,000, your CFO is thinking: “We’ve spent money on training before. What makes this different?”
There’s also the accountability gap. When you buy software, you can measure adoption rates, process improvements, time savings. When you buy equipment, you can track output increases, defect reductions, maintenance cost decreases. Leadership training outcomes feel subjective, until you learn to measure them the way CFOs measure everything else.
Past failures create legitimate skepticism. If your organization has tried leadership development before without clear results, you’re fighting that history. Your business case needs to address it directly: “Here’s why previous initiatives didn’t deliver, and here’s what we’re doing differently.”
The good news? When you build your case on CFO-friendly metrics and demonstrate clear measurement rigor, that skepticism transforms into strategic partnership. CFOs want effective leadership as much as you do. They just need you to prove it works.
The Hard ROI Numbers CFOs Actually Care About
Let’s cut to what matters: the financial returns that make CFO eyes light up instead of glaze over.
Average Returns: $7 for Every $1 Invested
Research on first-time manager training shows that every dollar invested delivers returns between $3 and $11, with an average of $7. This isn’t theoretical—it’s based on measurable outcomes across hundreds of organizations.
More specifically, first-time manager training delivers a 29% ROI in just three months and a 415% annual return. That means for every $1 spent, businesses gain $4.15 back within the first year. Better Manager’s leadership development study confirms these ranges, with 42% of organizations reporting direct revenue increases attributable to leadership development.
But averages don’t convince CFOs. Specific, measurable business impact does. That’s where you need to dig into the components.
Quantifying the Business Impact in CFO Terms
Here’s where most proposals fail: They talk about “better leadership” without translating that into dollars. Let me show you how to make the translation CFOs understand.
1. Retention Savings (The Big One)
This is your most powerful argument because it’s the easiest to measure and the hardest for CFOs to dispute.
2024 training industry data shows that replacing an employee costs an average of 33.3% of their base salary. For specialized roles, that jumps to 50% or even higher when you factor in recruiting fees, interviewing time, onboarding, training, and lost productivity during the ramp-up period.
Leadership development dramatically reduces turnover. Forrester Total Economic Impact study found that effective leadership programs improve retention by 12%. Other research shows improvements ranging from 12% to 29% depending on program quality and organizational context.
Let me show you what this means in real dollars:
Example calculation:
Company size: 500 employees
Current annual turnover: 20% (100 employees leaving)
Average salary: $75,000
Replacement cost: $75,000 × 0.33 = $24,750 per employee
Current annual turnover cost: 100 × $24,750 = $2,475,000
Now apply a conservative 15% retention improvement from leadership development:
Employees retained: 100 × 0.15 = 15 employees
Savings: 15 × $24,750 = $371,250 annually
That’s nearly $400,000 in hard cost avoidance from retention alone. And this is using conservative estimates.
The case study that makes CFOs pay attention: Hitachi Energy saw an 80% reduction in salaried turnover and 25% reduction in hourly turnover after launching comprehensive leadership training. When you can point to examples like that, skepticism evaporates.
2. Productivity & Performance Gains
Here’s a statistic that hits CFO hot buttons: Research shows that 70% of the variance in team engagement is attributable to the manager. Not the work. Not the compensation. Not the office perks. The manager.
Engaged teams show 21-23% higher profitability according to multiple studies. Leadership training that improves manager effectiveness drives measurable productivity improvements averaging 12% across well-structured programs.
Example calculation:
Department annual output value: $2,000,000
Isolated productivity improvement from leadership training: 9% (after controlling for other factors)
Additional output value: $2,000,000 × 0.09 = $180,000
For a $50 million revenue company, a 12% productivity improvement across leadership-managed teams translates to approximately $6 million in additional output value. Even if you attribute only half of that improvement to training specifically, you’re looking at $3 million in measurable impact.
3. Internal vs. External Hiring Cost Advantage
External hires have a 61% higher failure risk compared to internal promotions. Think about what that means: When you hire a senior manager externally at $150,000 salary and they fail within 18 months, you’ve lost $300,000+ (200% of salary) in direct costs, plus the opportunity cost and team disruption.
Leadership development builds your internal promotion pipeline. Organizations with strong development programs promote from within at significantly higher rates, avoiding both the premium costs of external recruiting and the elevated failure risk.
Example calculation:
External senior hire total cost (recruiting, premium salary, risk): $200,000
Internal promotion development cost plus salary adjustment: $50,000
Savings per internal promotion: $150,000
If leadership training enables 3 additional internal promotions annually: $450,000 saved
4. Reduced Management Failure Costs
Sixty percent of first-time managers report feeling unprepared for their roles. The costs show up everywhere: employees reporting to ineffective managers are five times more likely to consider leaving. Poor managers create conflict that requires HR intervention, performance issues that drain senior leadership time, and cultural toxicity that spreads.
Training reduces this failure rate measurably. When managers are equipped with actual skills, giving feedback, conducting development conversations, managing conflict, building psychological safety, the downstream costs disappear.
These aren’t soft benefits. They’re cost avoidance that shows up in your turnover data, your HR intervention time, and your team performance metrics.
The ROI Formula CFOs Will Actually Accept
Now let’s get into the mechanics your CFO will scrutinize. The formula itself is straightforward. Making it bulletproof requires rigor.

The Standard ROI Calculation
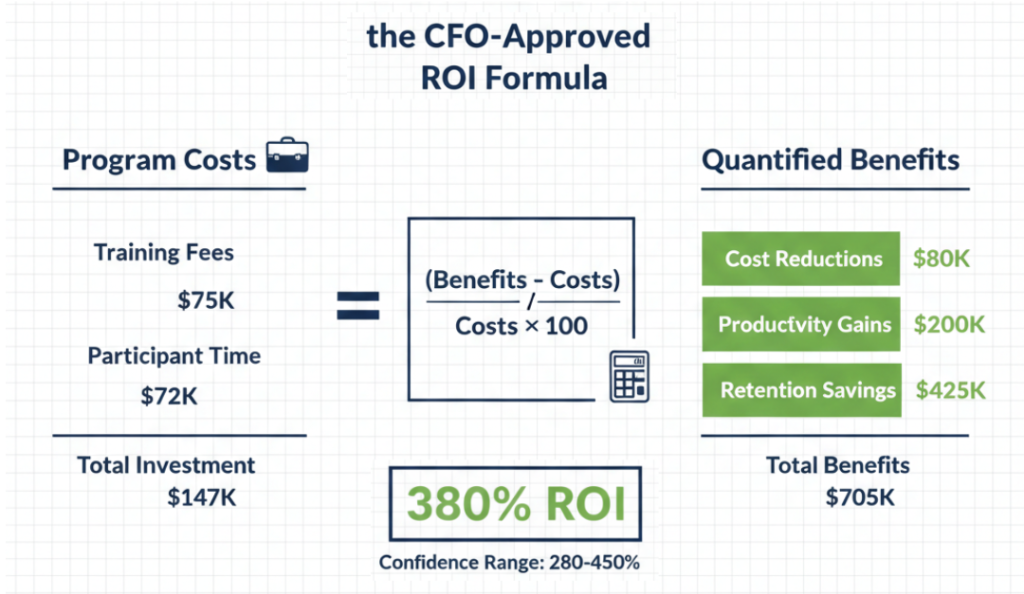
ROI = (Total Benefits – Program Costs) / Program Costs × 100
If the result is greater than 100%, you’re receiving more value than the initial investment. At 200%, you’re doubling your money. At 415% (the first-time manager training average), you’re getting $5.15 back for every dollar invested.
Simple formula. Complex execution. Here’s where most proposals fail: They either inflate benefits without proper isolation or undercount costs and look unrealistic. Let me show you how to do both correctly.
What Goes Into “Program Costs”
Be comprehensive here. CFOs will catch any cost you omit, and it destroys credibility. Include:
Direct training expenses:
Facilitator/provider fees
Training materials and resources
Platform or technology costs (if using digital learning)
Assessment tools (360-degree feedback, personality assessments, etc.)
Participant time costs: This is where many proposals stumble. If you’re training 150 managers for 8 hours each, that’s 1,200 hours of productive time redirected to learning. Calculate it: 150 participants × 8 hours × $60 average hourly rate = $72,000 in time costs.
CFOs think this way automatically. If you don’t include it, they’ll add it themselves and question your analysis rigor.
Administrative overhead:
Program design and planning time
Coordination and scheduling
Progress tracking and measurement
Follow-up reinforcement sessions
Example total investment:
Training program fees: $75,000
Participant time costs: $72,000 (150 managers × 8 hours × $60/hr)
Materials and platform: $8,000
Administrative coordination: $12,000
Total investment: $147,000
What Goes Into “Total Benefits” (The CFO-Convincing Part)
This is where you win or lose the CFO. Benefits must be isolated, quantified, and defensible. Here’s the framework:
1. Retention Savings
Calculate: (Number of employees retained due to training) × (Replacement cost per employee)
The key word is “due to training.” You need baseline turnover data and post-training comparison. Control for other factors (market changes, compensation adjustments, organizational restructuring).
Conservative approach: If turnover drops from 22% to 18%, attribute half of that improvement to training and half to other factors. That gives you 2% improvement directly tied to the program.
Example:
500 employees
Baseline turnover: 22% (110 employees annually)
Post-training turnover: 18% (90 employees annually)
Conservative attribution: 50% of improvement
Employees retained due to training: (110 – 90) × 0.5 = 10 employees
Average replacement cost: $25,000
Retention benefit: 10 × $25,000 = $250,000
2. Productivity Improvements
Measure pre-training vs. post-training performance metrics in specific, quantifiable terms:
Sales team: Revenue per rep, deals closed, customer retention
Operations: Output per hour, defect rates, project completion times
Service: Customer satisfaction scores, resolution times, escalation rates
The critical step: Isolate training impact from other variables. If you implement new CRM software and leadership training simultaneously, you can’t attribute all improvement to training. The confidence-scoring framework helps here.
Example:
Measured productivity improvement: 12%
Isolated training contribution (after controlling for new processes): 9%
Department annual output value: $2,000,000
Productivity benefit: $2,000,000 × 0.09 = $180,000
3. Cost Reductions
Quantify:
Reduced external recruiting and hiring costs (more internal promotions)
Fewer management failures requiring intervention or replacement
Less time spent by senior leaders managing conflicts and performance issues
Reduced HR intervention time for team problems
Example:
External senior hires avoided: 2 positions (filled internally instead)
Savings per avoided external hire: $40,000 (recruiting premium + risk reduction)
Cost reduction benefit: 2 × $40,000 = $80,000
4. Revenue Impact (When Applicable)
Forty-two percent of organizations report revenue increases directly attributable to leadership development. If your managers lead customer-facing teams, better leadership translates to:
Improved customer satisfaction and retention
Higher sales team performance
Better client relationships and upsell opportunities
Be conservative here unless you have tight attribution. If you can’t draw a clean line from training to revenue, focus on retention and productivity benefits instead.
The Confidence-Adjusted Approach CFOs Respect
Here’s what separates amateur proposals from professional ones: Acknowledging measurement uncertainty while still providing actionable data.
Don’t present ROI as a single precise number. Present it as a range that reflects confidence in your attribution methods.
Conservative scenario (lower confidence in attribution):
Reduce projected benefits by 30-40%
Assume only the most directly measurable impacts
Result: 17% ROI minimum
Optimistic scenario (higher confidence in attribution):
Use full projected benefits with strong measurement controls
Include secondary benefits with clear causation
Result: 39.5% ROI maximum
CFO presentation: “Based on conservative projections, ROI ranges from 17% to 39.5% depending on attribution confidence. Even at the low end, we’re profitable within 18 months.”
This approach shows analytical rigor. CFOs respect uncertainty acknowledged professionally more than false precision.
Worked Example: The Complete Calculation
Let me put it all together with real numbers:
Investment:
Training program: $75,000
Participant time: $72,000
Total: $147,000
Benefits (Conservative):
Retention savings: $250,000 (10 employees retained)
Productivity improvements: $180,000 (9% isolated gain)
Cost reductions: $80,000 (recruiting savings)
Total benefits: $510,000
ROI Calculation: ($510,000 – $147,000) / $147,000 × 100 = 247% ROI
Translation for your CFO: “For every dollar invested in leadership training, we’re generating $3.47 in measurable business value. The program pays for itself within 6 months based on retention savings alone.”
That’s a business case that gets approved.
Beyond the Formula: Metrics That Close the Deal
ROI calculations get you in the door. Ongoing measurement keeps the program funded. Here’s what CFOs want to track.
Leading Indicators CFOs Can Track Quarterly
These show progress before financial results fully materialize:
Manager effectiveness scores (360-degree feedback): Track changes in how direct reports, peers, and supervisors rate manager performance. Set targets: 15-point improvement on 100-point scale within 6 months.
Employee engagement survey results by team/manager: Measure team engagement scores and track changes. Correlate with specific managers who completed training. Target: Engagement scores move from bottom quartile to second quartile within 9 months.
Internal promotion rate vs. external hiring rate: Track the percentage of leadership positions filled internally vs. externally. Target: Increase internal promotion rate from 40% to 60% within 18 months.
Time-to-productivity for new managers: Measure how quickly promoted managers reach full effectiveness. Target: Reduce ramp-up time from 9 months to 6 months.
Team retention rates by manager: Track turnover on each manager’s team specifically. Identify which trained managers show the biggest retention improvements. Target: Top quartile retention (under 10% annual turnover) for 70% of trained managers.
These leading indicators signal whether the training is working before full financial impact shows up. Quarterly reporting on these metrics keeps CFOs confident in the investment.
Lagging Indicators That Prove Long-Term Value
These take longer to materialize but deliver the hard financial proof:
Annual turnover rate trends: Year-over-year comparison showing sustained improvement. Report both overall organizational turnover and turnover specifically in teams led by trained managers.
Total replacement cost savings year-over-year: Calculate: (Previous year turnover × replacement cost) – (Current year turnover × replacement cost) = Savings
Revenue per employee improvements: Total revenue ÷ total employees. Track whether productivity gains show up in this efficiency metric CFOs monitor anyway.
Customer satisfaction scores: Many organizations find that better leadership correlates with better customer outcomes. If you have Net Promoter Score or customer satisfaction data by team, track it.
Promotion pipeline strength: How many internal candidates are ready for next-level roles? Strong leadership development builds bench strength, reducing succession risk.
The Kirkpatrick Model Translation for CFOs
Training evaluation research typically references Kirkpatrick’s Four Levels. Here’s the CFO translation:
Level 1 (Reaction): Did participants like the training? CFO translation: “I don’t care if they liked it. Did it work?”
Level 2 (Learning): Did they learn new skills? CFO translation: “Knowledge without application is worthless to me.”
Level 3 (Behavior): Are they applying it on the job? CFO translation: “Now we’re getting somewhere. Show me behavior change.”
Level 4 (Results): What business outcomes resulted? CFO translation: “This is all that matters. Show me retention, productivity, profitability.”
Your pitch must focus almost exclusively on Levels 3 and 4. You can mention Levels 1 and 2 as quality indicators, but don’t lead with them. CFOs fund results, not satisfaction scores.
How Do You Prove Leadership Training ROI to a CFO?
The question every L&D professional asks before walking into the budget meeting. Here’s the framework that works.
Use the confidence-adjusted formula with isolated, quantified benefits tied directly to CFO priorities like retention savings, productivity gains, and reduced hiring costs, presented as a measurable range with quarterly tracking milestones. That’s the short answer. Here’s the step-by-step execution:
Step 1: Baseline your current costs
Before you can show improvement, you need to know where you are. Gather:
Current annual turnover rate (overall and by department)
Average replacement cost per employee
Current external hiring rate vs. internal promotion rate
Manager failure incidents (how many managers struggled or failed in last 24 months)
Total external recruiting spend annually
Put dollar figures to all of it. This becomes your “cost of doing nothing” baseline.
Step 2: Set specific, measurable objectives
Vague goals kill credibility. “Better leadership” doesn’t cut it. Set targets like:
Reduce overall turnover from 22% to 18% (saving $X based on replacement costs)
Improve average manager effectiveness score from 68 to 78 (15-point improvement)
Increase internal promotion rate from 35% to 55%
Achieve 80%+ engagement scores for teams led by trained managers
Each objective should have a dollar value or clear business impact.
Step 3: Calculate realistic benefit projections
This is where you differentiate yourself from amateur proposals. Use conservative estimates:
Don’t claim 50% turnover reduction; claim 10-15%
Don’t assume 100% attribution to training; assume 50-70%
Don’t project immediate results; show 3-month, 6-month, 12-month timelines
Run scenarios: best case, likely case, worst case. Show your CFO all three. The worst case should still be profitable.
Step 4: Present with confidence ranges and tracking plan
“Our conservative projection shows 180% ROI. Our likely scenario shows 280% ROI. Even if we only achieve half of our conservative projection, we break even within 12 months. And here’s how we’ll measure quarterly to ensure we’re on track.”
Include the specific metrics you’ll report quarterly. Propose check-in meetings at 90 days, 6 months, and 12 months to review progress.
Step 5: Propose a pilot program with tight measurement
If your CFO remains hesitant, offer a lower-risk approach: “Let’s pilot this with 50 managers for 6 months at $35,000 investment. We’ll measure the same KPIs, and if we don’t see measurable improvement in retention and engagement scores, we stop there.”
This demonstrates confidence in the program while reducing CFO risk. Many times, successful pilots lead to full-scale rollouts with enthusiastic CFO support.
The key throughout: Speak CFO language. Not potential. Not development. Not transformation. Cost avoidance, productivity improvement, profitability impact, measurable returns.
What Are the Biggest CFO Objections to Leadership Training Budgets?
Let me give you the script for handling the objections you’ll face. I’ve heard them all, and here’s how to respond with data, not defensiveness.
The top three CFO objections are budget constraints (“we can’t afford it”), uncertain outcomes (“how do we know it’ll work?”), and competing priorities (“other investments show clearer ROI”). Each requires a specific, data-driven response. Let’s tackle them one by one.
Objection 1: “We can’t afford it right now”
This is rarely about actual inability to pay. It’s about prioritization and perceived risk. Your response needs to reframe the investment.
Your response: “I understand budget is tight. That’s exactly why we need to address our $2.5 million annual turnover problem. We’re not asking for new spend—we’re proposing to protect existing budget that’s currently bleeding out. At our current 22% turnover rate, we’re replacing 110 employees annually at $22,500 each in hard costs. Leadership development that reduces turnover by just 15% saves $371,000 annually—more than double the program investment.
If budget is the concern, we can phase the approach. Start with a pilot: 25 managers, $35,000 investment, 90-day measurement window. If we retain just 8 employees we would have otherwise lost, the pilot pays for itself. Then we expand with confidence.”
The key move: Reframe from “new expense” to “cost avoidance protecting existing budget.”
Objection 2: “How do we know it will work?”
This is the “we’ve been burned before” objection. Past training failures haunt your proposal.
Your response: “That’s exactly why measurement is built into this proposal, not added as an afterthought. We’re not asking you to take a leap of faith. Here’s what’s different from previous initiatives:
First, we’re tying this to specific business metrics you already track: turnover rate, engagement scores, internal promotion rate. Not completion certificates—actual business outcomes.
Second, we’re implementing quarterly tracking with clear milestones. At 90 days, we’ll review leading indicators—engagement score movement, manager effectiveness ratings. If we don’t see positive trends, we adjust immediately.
Third, we’re learning from failures. Here are the organizations that succeeded: Hitachi Energy reduced turnover 80% for salaried employees and 25% for hourly. Not theoretical—measurable. The difference? They measured rigorously and tied development to actual business priorities, not generic skills.
We’re proposing the same rigor. And if after 6 months we don’t see measurable improvement in retention and engagement, we’ll be the first to recommend stopping.”
The key move: Replace “trust us” with “measure everything, adjust or stop if it doesn’t work.”
Objection 3: “Why not just hire better managers?”
This sounds logical until you run the numbers.
Your response: “That’s a fair question. Let’s look at the math. External hires for management positions fail at a 61% higher rate than internal promotions. When you hire a manager externally at $120,000 salary and they fail within 18 months, you’ve lost $240,000+ in direct costs alone—not counting team disruption and the impact on the people who leave because of poor management.
Additionally, the market for qualified managers is brutal right now. We’re competing with larger firms offering 20-30% salary premiums. Even when we win, we’re paying premium rates for external talent versus developing internal candidates who already understand our culture, systems, and business.
Leadership development isn’t either/or. It’s both/and. We still hire externally when needed, but we dramatically reduce the dependency and cost. Organizations with strong internal development programs fill 60-70% of leadership roles internally versus our current 35%. That translates to hundreds of thousands in avoided recruiting fees and reduced risk.”
The key move: Make it a cost comparison, not a philosophical debate.
Objection 4: “We tried training before, it didn’t work”
Address the elephant directly.
Your response: “You’re right, and that failure informs this proposal. I reviewed what we did previously. We sent managers to generic offsite programs, measured completion rates, collected satisfaction surveys, and saw no business impact. We made three critical mistakes:
First, we didn’t tie training to specific business metrics. No baseline, no targets, no measurement of actual behavior change or business outcomes.
Second, we focused on knowledge transfer, not application. Managers learned concepts but had no accountability for applying them or changing how they lead.
Third, we treated it as a one-time event instead of a developmental process with reinforcement, practice, and sustained support.
This proposal addresses all three. We’re using NLP-based training methodology focused on practical application, not theory. We’re measuring business outcomes monthly, not just participant reactions. And we’re building in reinforcement over 12 months, not a two-day event.
Different provider, different methodology, different measurement rigor. And if it produces the same non-results, we stop and try something else.”
The key move: Acknowledge the failure, explain why this is different with specifics.
Objection 5: “Training is HR’s job, not a business priority”
This is the positioning problem that kills proposals.
Your response: “I appreciate you raising that because it highlights exactly why this proposal is framed wrong. This isn’t training. It’s talent optimization supporting your number one priority: operational efficiency.
Right now, ineffective managers create direct costs: 22% turnover equals $2.5 million annually. That’s not an HR metric—that’s a profitability issue. Seventy percent of team engagement variance comes from the manager. Poor engagement drives turnover, reduces productivity, and shows up in every operational metric you track.
We’re proposing to fix a $2.5 million efficiency problem by investing $150,000 to develop the 80 managers who supervise 360 employees—nearly half our workforce. This is productivity infrastructure, the same way we invest in systems and processes.
It connects directly to the operational efficiency goals already approved in the strategic plan. Better managers mean lower turnover costs, higher team productivity, and reduced management failures that currently consume senior leadership time.
The measurement framework treats this exactly like any other operational improvement initiative: baseline metrics, specific targets, quarterly tracking, ROI calculation. This is business investment with projected 280% returns, not an HR program.”
The key move: Completely reframe from “HR training” to “operational efficiency investment.”
The CFO-Approved Pitch Framework: What to Say in the Meeting
Let me walk you through the actual meeting. I’ve coached dozens of L&D leaders through this, and here’s the structure that wins.
Before the Meeting: Build Your Business Case Document
Create a one-page executive summary (CFOs love one-pagers) with these elements:
Current State Costs: “Our 22% annual turnover rate costs $2.475M in direct replacement expenses (110 employees × $22,500 average replacement cost). Additionally, 68% of our managers report feeling unprepared, showing up in bottom-quartile engagement scores that drive the turnover.”
Proposed Investment: “$150,000 comprehensive leadership development program: $75K training + $72K participant time + $3K materials”
Projected ROI Range: “Conservative: 180% ROI ($270K net benefit). Likely: 280% ROI ($420K net benefit). Achievable even if we only retain 12 employees who would have otherwise left.”
Break-Even Timeline: “6 months based on retention savings alone. Full ROI realized within 12 months.”
Measurement Plan: “Quarterly reporting on: turnover rate by manager, engagement scores, manager effectiveness ratings, internal promotion rate, total replacement costs vs. baseline”
Attach detailed calculations as appendix. Lead with the one-pager. Have your ROI measurement framework ready for questions.
Opening (First 60 Seconds)
“I’m here to propose a $150,000 investment that directly addresses our third-largest cost driver, employee turnover and supports your operational efficiency mandate. Based on conservative projections, we’ll see $270,000 in retention savings alone in year one, delivering 180% ROI, with measurable leading indicators visible within 90 days.”
Why this works: You’ve immediately answered the CFO’s internal questions: How much? What for? What return? When will I see it?
The Problem Statement (Tie to CFO’s Priorities)
“Right now, we’re losing 110 employees annually at an average replacement cost of $22,500 each, $2.475 million bleeding from the budget year after year. Our manager effectiveness scores sit at 64 out of 100, and our engagement scores are bottom quartile for our industry.
Sixty-eight percent of our managers report feeling unprepared for their roles, which shows up directly in team turnover rates. Teams led by our lowest-scoring managers have 35% turnover versus 12% for our highest-scoring managers. That 23-point gap is costing us hundreds of thousands.
This is a productivity and cost control issue. Better leadership directly reduces our single largest controllable cost while improving operational efficiency across 45% of our workforce.”
Why this works: You’ve translated “leadership gap” into “cost problem” using CFO language.
The Solution (Framed as Business Investment)
“We’re proposing comprehensive leadership development targeting our 80 frontline managers—the leaders who directly supervise 360 employees. This isn’t generic training. It’s a business performance intervention focused specifically on the behaviors that drive retention: conducting effective career development conversations, providing regular feedback, building team engagement, recognizing contributions, and spotting burnout before it leads to resignations.
The program uses corporate coaching approaches proven to deliver measurable results, with emphasis on practical application over theoretical knowledge. Managers will apply new skills immediately with their teams, supported by reinforcement over 12 months.”
Why this works: You’ve positioned it as “business intervention” not “training program.”
The ROI Breakdown (Show Your Math)
Walk through the calculation methodically:
“Here’s how the ROI breaks down using conservative assumptions.
Investment: $150,000 total
Training program: $75,000
Participant time: $72,000 (80 managers × 8 hours × $60 average rate)
Materials and support: $3,000
Projected Benefits (Conservative Scenario):
Retention savings: A 15% improvement in our 22% turnover rate means we retain 17 employees we would have otherwise lost. At $22,500 replacement cost each, that’s $382,500 in direct savings.
Productivity gains: Research shows managed teams improve productivity 10-12% after effective leadership development. Applied to the $2.8 million in annual output from teams led by trained managers, even a conservative 8% isolated improvement equals $224,000 in additional productive capacity.
Reduced external hiring: Developing internal managers means we fill 3 additional senior positions internally instead of recruiting externally, saving approximately $40,000 per position in recruiting fees and risk reduction. That’s $120,000.
Total Conservative Benefits: $726,500
ROI Calculation: ($726,500 – $150,000) / $150,000 × 100 = 384% ROI
Even if we only achieve half these benefits, if we retain just 9 employees and see 4% productivity improvement, we still generate 150% ROI and break even within 9 months.”
Why this works: Transparent math with conservative assumptions shows analytical rigor. The “even if we’re half wrong” framing addresses risk.
The Measurement Plan (Removes “Leap of Faith”)
“We’re proposing quarterly measurement on five specific metrics, all of which you already track or can easily track:
1. Turnover rate by manager (tracks which trained managers show retention improvement) 2. Manager effectiveness scores (360-degree feedback quarterly) 3. Employee engagement by team (quarterly pulse surveys) 4. Internal promotion rate (tracking internal pipeline development) 5. Total replacement costs (running total vs. baseline)
At 90 days, we review leading indicators. If manager effectiveness scores aren’t improving and engagement isn’t moving positively, we adjust the program immediately.
At 6 months, we calculate interim ROI based on actual retention data. If we’re not on track to at least break even, we stop and reassess.
This isn’t a leap of faith. It’s a measured investment with clear go/no-go decision points based on data.”
Why this works: You’ve eliminated the “trust us” factor with concrete measurement and decision triggers.
The Ask + Pilot Option
“I’m requesting approval for the full program, $150,000 investment with projected 384% ROI and quarterly measurement.
Alternatively, if you prefer to minimize risk, we can pilot with 25 managers for $35,000, measure rigorously for 6 months, and expand based on demonstrated results. The pilot allows us to prove the model with one-fifth the investment while still delivering measurable value.
Either approach protects the business. The full program delivers faster, broader impact. The pilot proves the model with lower risk. Both are viable.”
Why this works: You’ve given the CFO a decision: approve the full program or approve the pilot. Not approve or reject. Two yeses.
Closing
“This investment isn’t about making managers feel good. It’s about protecting the $2.475 million we’re currently losing to turnover and improving the productivity of 45% of our workforce. The ROI is demonstrable, the measurement is built in, and the risk is minimal compared to the cost of continuing to bleed talent and productivity.
Based on the numbers, this is one of the highest-return investments available to us right now. I’m confident we can deliver results, and I’m willing to stake the program on measurable outcomes.”
Why this works: Confident, outcome-focused close that frames inaction as the real risk.
After You Walk Out
Send a follow-up email within 24 hours with:
One-page executive summary attached
Detailed calculation spreadsheet attached
Two comparable case studies (organizations similar to yours that achieved results)
Proposed timeline for decision and implementation
Offer to answer any questions or provide additional analysis
CFOs appreciate thoroughness. Give them everything they need to defend the investment to their peers.
Building Your Custom ROI Calculator for Leadership Training

Let me give you the template to build your own calculator. This becomes your pitch foundation.
Step-by-Step Calculator Build
1. Input Current State Costs:
Total employees: ________
Current annual turnover rate: ________%
Number of employees leaving annually: Total employees × turnover rate = ________
Average salary across those roles: $________
Replacement cost multiplier: 0.33 (standard) or 0.50 (specialized roles)
Replacement cost per employee: Average salary × multiplier = $________
Current annual turnover cost: Employees leaving × replacement cost = $________
This is your baseline. The “cost of doing nothing” number.
2. Input Proposed Training Investment:
Training program cost: $________
Number of participants: ________
Training hours per participant: ________
Average hourly rate: $________
Participant time cost: Participants × hours × rate = $________
Materials, platform, tools: $________
Administrative coordination: $________
Total program investment: $________
3. Project Conservative Benefits:
Retention Improvement: Projected improvement in turnover rate: ________% (use 10-15% conservative)
Employees retained: Current annual departures × improvement percentage = ________
Replacement cost per employee (from above): $________
Retention savings: Employees retained × replacement cost = $________
Productivity Improvement: Projected productivity improvement: ________% (use 8-12% conservative)
Annual output value of managed teams: $________
Isolated training contribution (assume 70% attribution): Improvement % × 0.7 = ________%
Productivity value: Output value × isolated improvement = $________
Cost Reductions: External positions filled internally instead: ________ (estimate 2-3 conservative)
Savings per avoided external hire: $________ (typically $30,000-50,000)
Hiring cost savings: Positions × savings per position = $________
Total Projected Benefits: Retention + Productivity + Cost Reductions = $________
4. Calculate ROI:
Benefits – Costs = Net Benefit: $________
Net Benefit ÷ Total Investment × 100 = ROI: ________%
Break-even calculation: Months to break even: (Total Investment ÷ Monthly Benefit Rate)
If retention savings are $400K annually, that’s $33K monthly. $150K investment ÷ $33K monthly = 4.5 months to break even.
Confidence Adjustments
Create three scenarios in your spreadsheet:
Conservative (70% Confidence): Reduce all projected benefits by 30% Result: Lower-bound ROI = ________%
Likely (85% Confidence): Use projected benefits as calculated Result: Expected ROI = ________%
Optimistic (95% Confidence): Increase benefits by 15% (if you have strong evidence) Result: Upper-bound ROI = ________%
Present to CFO: “ROI ranges from [Conservative]% to [Optimistic]%, with [Likely]% as the expected outcome based on comparable programs. Even in the conservative scenario, we achieve [X]% return and break even within [Y] months.”
This range demonstrates analytical rigor while providing actionable decision-making data.
Build this calculator in Excel or Google Sheets. Update it with your actual organizational data. Use it in your pitch meeting. Make it available for CFO to play with assumptions.
When CFOs can see the math themselves and test different scenarios, approval becomes much easier. You’re not asking them to trust your numbers—you’re giving them the tool to verify them.
For additional frameworks on tracking these outcomes, explore goal achievement implementation strategies that ensure training translates to measurable results.
What Leadership Training Metrics Do CFOs Value Most?
Let me cut through the measurement noise and tell you exactly what CFOs care about versus what they ignore.
CFOs prioritize metrics that directly link to P&L impact—retention rate changes quantified as cost savings, productivity improvements measured as output per employee, and promotion pipeline strength reducing external hiring costs. Not engagement scores. Not satisfaction ratings. Not learning outcomes. Business outcomes.
Here’s the priority hierarchy from a CFO’s perspective:
1. Retention rate by manager (HIGHEST VALUE) This is the most direct cost impact. Track turnover for each manager’s team before and after training. Calculate the dollar savings: (Reduction in departures) × (Replacement cost) = Measurable value.
Why CFOs love it: It ties directly to a line item they already track (recruiting and onboarding costs) and shows immediate budget impact.
2. Cost per hire trends Track your average cost to fill positions over time. Effective leadership development should show:
Decreased need for external recruiting
Higher internal promotion rate
Reduced recruiting agency fees
Shorter time-to-fill for key roles
Why CFOs love it: It shows reduced dependency on expensive external talent acquisition.
3. Revenue/productivity per employee Total revenue ÷ total employees. Track this efficiency metric quarterly. Leadership development should drive productivity improvements that show up here.
Why CFOs love it: They’re already tracking this metric. You’re just connecting leadership development to existing CFO dashboards.
4. Internal promotion rate Percentage of leadership positions filled internally versus externally. Track the trend:
Baseline: 35% internal, 65% external
Target: 60% internal, 40% external after 18 months
Why CFOs love it: Internal promotions cost dramatically less than external hires and carry lower failure risk. This metric shows talent pipeline strength.
5. Time-to-productivity for new managers How long does it take newly promoted managers to reach full effectiveness? Measure time from promotion to achieving performance benchmarks.
Why CFOs love it: Faster productivity means faster ROI on promotion decisions and reduced opportunity cost.
6. Team performance metrics by manager Hard business outcomes for each manager’s team:
Sales teams: Revenue per rep, close rates, customer retention
Operations: Output per hour, defect rates, on-time delivery
Service: Customer satisfaction, resolution times, escalation rates
Why CFOs love it: These are business metrics they already monitor. You’re just organizing them by manager to show leadership impact.
7. Engagement scores (ONLY if tied to business outcomes) Engagement matters to CFOs only when you’ve demonstrated the correlation in your organization. If you can show “teams with engagement scores above 70 have 18% lower turnover,” then engagement becomes a leading indicator CFOs value.
Present it this way: “Engagement isn’t the goal—it’s a predictor of retention. Our data shows every 10-point increase in team engagement correlates with 5% lower turnover, which equals $X in cost savings.”
What CFOs Don’t Care About (Don’t Lead With These)
These metrics might matter to L&D, but they’re invisible to CFOs:
Training completion rates: “100% of managers completed the program” = “So what? Did it work?”
Participant satisfaction scores: “95% rated the training highly” = “I don’t pay for high ratings. I pay for results.”
Hours of training delivered: “We delivered 640 training hours” = “How many dollars did those hours return?”
Certifications earned: “All participants earned leadership certification” = “Certificates don’t reduce turnover.”
Knowledge test results: “Average post-training score: 87%” = “Knowledge without application is worthless.”
The brutal truth: CFOs view these as activity metrics, not outcome metrics. They indicate you did something, not that the something worked.
The Translation Strategy
If you’ve been tracking “soft” metrics like engagement, communication quality, or leadership confidence, don’t abandon them. Translate them.
Instead of: “Engagement scores improved 15 points” Say: “Engagement scores improved 15 points, which our data shows correlates with 9% lower turnover. Applied to the 200 employees on trained managers’ teams, that’s 18 retained employees worth $405,000 in avoided replacement costs.”
Instead of: “Manager feedback skills improved significantly” Say: “Managers who demonstrated improved feedback skills in 360 reviews saw 22% better team performance outcomes and 14% lower turnover on their teams.”
Instead of: “Leadership confidence increased” Say: “Managers reporting higher confidence were 3x more likely to successfully handle difficult performance conversations early, reducing terminations and involuntary turnover by 31%.”
See the pattern? Connect every soft metric to a hard business outcome. That’s how you speak CFO language while still tracking the developmental indicators L&D needs.
When you walk into that CFO meeting, lead with retention rates, productivity metrics, and cost savings. Have the engagement and development data ready when they ask “How do we know the training actually caused these improvements?” But don’t lead with it.
CFOs fund what they can measure in dollars and cents. Give them exactly that.
FAQs
What is the average ROI of leadership training?
Research indicates that leadership training delivers an average return of $7 for every $1 invested. Depending on program quality, returns typically range from $3 to $11. Specifically, first-time manager training can yield a 29% ROI within three months and up to 415% annual returns by reducing turnover costs and increasing team productivity.
How do you calculate the ROI of leadership development for a CFO?
To calculate leadership training ROI in a way CFOs trust, use the Confidence-Adjusted ROI Formula:
$$ROI = \frac{(\text{Total Benefits} – \text{Program Costs})}{\text{Program Costs}} \times 100$$
Total Benefits should include:
Retention Savings: (Number of employees retained due to training) × (33% of average salary).
Productivity Gains: Isolated performance increases (averaging 9-12%).
Hiring Cost Avoidance: Savings from internal promotions vs. external hires (which fail 61% more often).
What are the biggest CFO objections to leadership training budgets?
The three most common objections are budget constraints, uncertain outcomes, and competing priorities.
Budget: Address this by reframing training as “cost avoidance” to stop turnover “bleeding.”
Uncertainty: Propose a pilot program with a 90-day measurement window and clear KPIs.
Priorities: Align the program with existing operational efficiency goals, treating leadership as “productivity infrastructure.”
How much does it cost to replace an employee in 2024-2025?
Replacing an employee costs an average of 33.3% of their base salary. For specialized or senior roles, these hard costs (recruiting, onboarding, and lost productivity) can escalate to 50%–200% of their annual salary. Effective leadership training can reduce these costs by improving retention rates by 12% to 29%.
Why do CFOs skeptically view leadership development programs?
Skepticism is largely driven by poor historical results: 75% of organizations rate their leadership programs as “not very effective,” and only 18% of leaders are viewed as effective at achieving business goals. To overcome this, proposals must move past “completion certificates” and focus on Level 4 (Results) of the Kirkpatrick Model: measurable business outcomes like profitability and retention
Your Path to CFO Approval Starts Now
Here’s what we know: Leadership training isn’t an HR luxury, it’s a business necessity with measurable returns that speak directly to CFO priorities.
While 75% of organizations struggle with ineffective leadership programs, the 25% who get it right see transformational results: $7 average return for every dollar invested, 415% annual ROI for first-time manager training, retention improvements of 12-29%, and productivity gains that show up in every operational metric CFOs already track.
The difference between proposals that die in budget reviews and those that get enthusiastic approval isn’t the quality of the training. It’s the quality of the business case. When you demonstrate clear ROI using confidence-adjusted calculations, tie every benefit to existing CFO priorities like cost control and operational efficiency, provide quarterly measurement with built-in decision triggers, and reframe training as strategic business investment rather than HR expense, skepticism transforms into partnership.
Think back to that opening scenario, you sitting across from your CFO with a $150,000 leadership training proposal. Now you have something different. You have the formula showing 384% ROI. You have the measurement plan proving results in 90 days. You have the objection responses ready for every “but what about…” question. You have the pilot option if they need to start smaller. You have the calculator built with your organization’s actual numbers.
That $150,000 investment isn’t a cost anymore. It’s protection for the $2.5 million currently bleeding from turnover. It’s a productivity intervention for 45% of your workforce. It’s measurable, defensible, and more profitable than most initiatives competing for the same budget dollars.
Your competitive advantage isn’t waiting for perfect market conditions or unlimited budgets. It’s building the capability of your leaders while competitors view development as discretionary. It’s creating the retention and productivity infrastructure that compounds value year after year.
The formula works. The measurement frameworks exist. The case studies prove it. What’s required now is action: Build your calculator this week. Run your organization’s numbers. Calculate your current turnover costs and projected savings. Schedule the CFO meeting. Make the case using their language, their metrics, their decision framework.
You have everything you need to turn your leadership development proposal into a CFO-approved strategic investment.
Ready to build a CFO-approved business case for leadership development that delivers 7x ROI? Book your free 30-minute strategy call with Unleash Your Power today to map out your customized ROI framework, review your numbers, and develop your pitch approach. We’ll help you translate your leadership development vision into the hard financial metrics CFOs demand and approve.